NFL Preseason Predictions 2016: Projections For All 32 Teams
September 5, 2016 – by David Hess
Below are our official preseason NFL predictions and projected standings for 2016. We’ve included a few highlights, plus some tips on how to interpret the numbers.
NFL Preseason Predictions Performance
As Sports Illustrated’s MMQB reported, statistics professor and sports analytics enthusiast Michael Lopez found our NFL preseason projections to be the most accurate system in both 2013 and 2014. Perhaps more importantly, our system was more accurate than Vegas preseason win totals in both years.
Greg didn’t publish rankings for the 2015 season, but we tracked our own results, and we again beat the Vegas win totals. For team win totals where our projected win distributions indicated there was value on betting the Over or the Under, our picks went 17-9.
(Note: If you’re in an NFL pool or you’re betting games, check out our Football Pick’em Pool Picks and NFL Betting Picks. An amazing 70% of our subscribers win a prize in a football pick’em pool each year.)
During the season, we update these NFL predictions every day on our NFL projected standings page.
2016 Predictions & Projected Standings:AFC | NFC
Additional Info:How do we come up with these predictions?Exactly what do these numbers mean?Why does our approach make sense?
AFC Predictions 2016
| AFC East | W | L | Playoffs | Win Div | Top Seed | Win SB |
| New England | 10.4 | 5.6 | 68.9% | 56.7% | 18.4% | 11.0% |
| Buffalo | 7.9 | 8.1 | 33.0% | 18.7% | 3.6% | 2.1% |
| NY Jets | 7.1 | 8.9 | 23.7% | 13.5% | 2.3% | 1.3% |
| Miami | 7.0 | 9.0 | 21.0% | 11.1% | 1.5% | 0.9% |
| AFC North | W | L | Playoffs | Win Div | Top Seed | Win SB |
| Pittsburgh | 9.9 | 6.1 | 61.5% | 40.4% | 14.1% | 6.6% |
| Cincinnati | 9.8 | 6.2 | 58.7% | 39.1% | 12.9% | 6.2% |
| Baltimore | 7.9 | 8.1 | 32.9% | 17.4% | 4.4% | 1.8% |
| Cleveland | 5.2 | 10.8 | 7.2% | 3.0% | 0.4% | 0.1% |
| AFC South | W | L | Playoffs | Win Div | Top Seed | Win SB |
| Houston | 8.2 | 7.8 | 44.6% | 37.0% | 4.5% | 2.2% |
| Indianapolis | 8.0 | 8.0 | 40.2% | 32.8% | 3.6% | 1.7% |
| Jacksonville | 7.0 | 9.0 | 26.7% | 21.2% | 2.2% | 0.9% |
| Tennessee | 5.4 | 10.6 | 11.4% | 8.9% | 0.4% | 0.2% |
| AFC West | W | L | Playoffs | Win Div | Top Seed | Win SB |
| Kansas City | 10.1 | 5.9 | 62.4% | 42.3% | 14.7% | 7.9% |
| Denver | 9.2 | 6.8 | 49.8% | 29.0% | 9.8% | 4.8% |
| Oakland | 7.9 | 8.1 | 30.4% | 15.4% | 4.1% | 1.8% |
| San Diego | 7.8 | 8.2 | 27.5% | 13.3% | 3.0% | 1.3% |
#1 Seed Pick: New England Patriots (18.4%), with 4 other teams between about a 10% and 15% chance (Steelers, Chiefs, Bengals, Broncos)
Most Improved: San Diego (from 4 to 7.8 wins)
Biggest Decline: New York Jets (from 10 to 7.1 wins) and Denver Broncos (from 12 to 9.2 wins)
Biggest Loser: Cleveland Browns (5.2 projected wins) and Tennessee Titans (5.4 projected wins)
NFC Predictions 2016
| NFC East | W | L | Playoffs | Win Div | Top Seed | Win SB |
| NY Giants | 7.8 | 8.2 | 37.4% | 31.3% | 3.1% | 1.2% |
| Dallas | 7.7 | 8.3 | 37.0% | 30.1% | 2.8% | 1.0% |
| Philadelphia | 6.7 | 9.3 | 25.1% | 19.8% | 1.6% | 0.6% |
| Washington | 6.6 | 9.4 | 23.7% | 18.7% | 1.2% | 0.5% |
| NFC North | W | L | Playoffs | Win Div | Top Seed | Win SB |
| Green Bay | 10.8 | 5.2 | 73.0% | 53.8% | 21.5% | 9.8% |
| Minnesota | 8.7 | 7.3 | 43.7% | 22.8% | 6.5% | 2.8% |
| Detroit | 7.7 | 8.3 | 29.1% | 13.3% | 2.9% | 1.1% |
| Chicago | 7.2 | 8.8 | 23.1% | 10.2% | 2.4% | 0.8% |
| NFC South | W | L | Playoffs | Win Div | Top Seed | Win SB |
| Carolina | 9.7 | 6.3 | 64.6% | 56.1% | 11.2% | 6.5% |
| New Orleans | 6.8 | 9.2 | 23.6% | 15.9% | 1.6% | 0.8% |
| Atlanta | 6.7 | 9.3 | 24.3% | 15.6% | 1.5% | 0.9% |
| Tampa Bay | 6.5 | 9.5 | 19.5% | 12.3% | 1.1% | 0.6% |
| NFC West | W | L | Playoffs | Win Div | Top Seed | Win SB |
| Arizona | 10.6 | 5.4 | 71.6% | 44.6% | 19.7% | 11.7% |
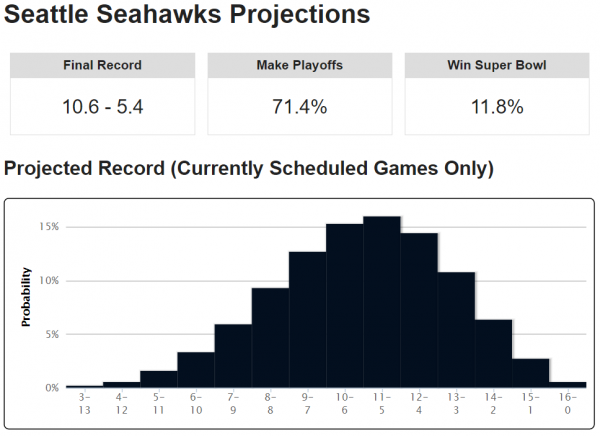
| Seattle | 10.6 | 5.4 | 71.4% | 43.5% | 20.0% | 11.8% |
| Los Angeles | 7.1 | 8.9 | 23.1% | 8.6% | 2.3% | 1.2% |
| San Francisco | 5.7 | 10.3 | 9.9% | 3.3% | 0.8% | 0.3% |
#1 Seed Pick: Green Bay packers (21.5%), with Seattle Seahawks (20.0%) and Arizona Cardinals (19.7%) close behind
Most Improved: Dallas Cowboys (from 4 to 7.7 wins)
Biggest Decline: Carolina Panthers (from 15 to 9.7 wins)
Biggest Loser: San Francisco 49ers (5.7 projected conference wins)
How We Predict The NFL Season
As we noted in our 2016 NFL preseason rankings blog post, we have identified a set of team-level metrics that have demonstrated predictive value for projecting a team’s upcoming season results.
We identified these metrics by reviewing about a decade’s worth of NFL data and applying significance tests to any interesting looking findings. Then, we built an algorithmic model that takes in these metrics as inputs, and computes a numerical preseason power rating for all 32 NFL teams.
A team’s preseason power rating signifies how good we think it will be this coming season. Figuring out precisely how many games we expect that team to win, however, is a much more complicated problem.
To do that, we run thousands of game-by-game computer simulations of the 2016 NFL season, using our predictive ratings to come up with implied win odds for each game.
Thanks to randomness, each season simulation plays out differently. Occasionally an unheralded team like Jacksonville or Chicago gets lucky, makes a run and wins the Super Bowl.
Over thousands of simulation runs, though, trends in the results begin to emerge. The 2016 preseason NFL predictions in this post represent the averages of all the season simulation runs we conducted.
Exactly What Do These NFL Predictions Mean?
It’s important to understand how our system generates the results it does, and precisely what they mean.
Here are the key details:
We end up projecting a lot of fractional wins. That obviously can’t happen in real life, but we don’t want to reduce precision in the numbers just to make them look prettier. For example, a projected 9.6 win team has worse prospects than a projected 10.4 win team. If we rounded, they’d look the same (10 wins each).Even if we project a team with X wins, it doesn’t necessarily mean we’re highly confident they’ll end up with that exact number. Let’s say we project a team with exactly 8 wins. In our season simulations, 8 wins may have been the most common outcome, but that team may have ended up with 7 or 9 wins nearly as often, and it even hit 5 or 11 wins some of the time. Our final projection, since it’s an average of all those numbers, ends up at 8 wins — but the odds of the team ending up with exactly 8 wins could still be as low as 15-20% or so.NFL predictions can change slightly day-to-day, even with no new game results. Because we re-simulate the season every day, randomness in simulation results may cause slight fluctuations in team projections from one day to the next, even if no new games have been played. So it’s wise not to read too much into tiny differences in the projections. A 0.1% difference in conference champion odds between two teams, for example, is not significant.
Why Is A Simulation-Driven Approach Valuable?
Despite some of the limitations, our data- and simulation-driven approach to making preseason predictions has proven to be a lot more accurate than the alternatives.
Human NFL “experts” (some of them, at least) can be decent at projecting the future performance level of a team — especially one they’ve studied closely. But on the whole, they tend to have a very poor grasp of the potential impacts of probability and randomness over the course of a full NFL season.
For example, even skilled “football people” tend to underestimate a great team’s odds of losing to a mediocre or bad team. While it’s true that a team like Seattle is unlikely to lose to a team like San Francisco, upsets happen routinely in the NFL, and those probabilities keep adding up game after game. So you can’t discount them, especially when division championships can be decided by just one win.
Running thousands of simulations to directly observe the distribution of outcomes generated by all the probabilities at play is a much more objective and precise way to do things.
When the dust settles at the end of the season, our preseason NFL predictions will almost certainly be way off for a few teams. As happens every year, some teams simply defy expectations, while other projections will be derailed by injuries, suspensions and other unexpected events that occur as the season goes on.
Our goal is the overall accuracy of the entire system, though — every prediction for every team. By that measure, our methodology has proven to be top-tier.
If you liked this post, please share it. Thank you! Twitter Facebook
NFL Football Pool Picks NFL Survivor Pool Picks NCAA Bracket Picks College Bowl Pool Picks College Football Pool Picks NFL Picks NBA Picks MLB Picks College Football Picks College Basketball Picks NFL Predictions NBA Predictions MLB Predictions College Football Predictions College Basketball Predictions NFL Spread Picks NBA Spread Picks MLB Spread Picks College Football Spread Picks College Basketball Spread Picks NFL Rankings NBA Rankings MLB Rankings College Football Rankings College Basketball Rankings NFL Stats NBA Stats MLB Stats College Football Stats College Basketball Stats NFL Odds NBA Odds MLB Odds College Football Odds College Basketball Odds A product ofTeamRankings BlogAboutTeamJobsContact
© 2005-2024 Team Rankings, LLC. All Rights Reserved. Statistical data provided by Gracenote.
TeamRankings.com is not affiliated with the National Collegiate Athletic Association (NCAA®) or March Madness Athletic Association, neither of which has supplied, reviewed, approved or endorsed the material on this site. TeamRankings.com is solely responsible for this site but makes no guarantee about the accuracy or completeness of the information herein.
Terms of ServicePrivacy Policy