College Bowl Pick’em Performance: How Our Picks Did In 2016-17
December 12, 2017 – by David Hess

This post reports on how our college football College Bowl Pick’em Picks did during the 2016-17 bowl season.
It also provides an explanation of how we measure the performance of our customized college bowl pick’em picks.
2016-17 College Bowl Pick’em Performance Results
Content:
ToggleKey Takeaways
Across all pool types, our customers were 5 times as likely to finish in first place and 3.6 times as likely to finish in the money compared to the average entrant in their bowl pools.Over the long term that would mean winning a 20-person pool once every 4 years if you use our picks, compared to once every 20 years if you pick on your own and are about average at doing it. (Quite a difference.)Our best performance last bowl season was in game winner based pools with confidence points. In those pools, our customers were 8 times as likely to win the pool, and 5.6 times as likely to finish in the money, compared to the average entrant in their pools.Our worst performance was in spread-based pools that did not use confidence points. In those pools, our customers were only as likely as an average entrant to finish first, but still 30% more likely to finish in the money.
So even in our worst performance area, our customers were still more likely than the average pool entrant to win something. And picks in game winner confidence pools delivered a huge edge.
(Note: The more you divide up a data set like this, the more likely you are to see some extreme performances — good or bad — just on account of luck. Even if our picks had finished in the money in 80% of pools, for example, there would likely be some type of pool where performance wasn’t spectacular.)
Results Data & Performance Splits
The table below shows data collected from our college football Bowl Pick’em Picks customers after the 2016-17 bowl season ended.
The data refers to individual pools, not individual users, since many of our users enter multiple pools.
Note that we’ve broken out the data by relative level of success (a “finished in first place” table followed by a “finished in the money” table, which indicates winning any type of prize), as well as by pool pick type.
| FINISHED IN FIRST PLACE | ||||
|---|---|---|---|---|
| Pick Type | Scoring | Expected Win Rate | Reported Win Rate | Win Rate Multiplier |
| Game Winner | Confidence Points | 4.9% | 39.1% | 8.0 |
| Game Winner | 1 Point Per Correct Pick | 4.5% | 13.8% | 3.1 |
| Point Spread | Confidence Points | 3.8% | 5.8% | 1.5 |
| Point Spread | 1 Point Per Correct Pick | 3.9% | 3.9% | 1.0 |
| Across all Pools | 4.5% | 22.5% | 5.0 | |
| FINISHED IN THE MONEY | ||||
|---|---|---|---|---|
| Pick Type | Scoring | Expected Win Rate | Reported Win Rate | Win Rate Multiplier |
| Game Winner | Confidence Points | 11.2% | 63.1% | 5.6 |
| Game Winner | 1 Point Per Correct Pick | 10.4% | 27.5% | 2.6 |
| Point Spread | Confidence Points | 12.3% | 15.4% | 1.3 |
| Point Spread | 1 Point Per Correct Pick | 9.9% | 13.2% | 1.3 |
| Across all Pools | 10.9% | 39.5% | 3.6 | |
Further Explanation
As you can see, we included both reported results data and expected results data for comparison purposes.
The ratio of those two numbers also provides a rough measurement of the positive or negative impact of our picks (the “Win Rate Multiplier”).
“Expected Win Rate” column. To get a baseline expectation for success in college bowl pick’em pools, we assume all entrants in customer pools users are equally skilled, and no one uses our picks. For example, in a 100-person bowl pick’em pool, we assume that each entrant’s chance to come in first place is 1% (1-in-100).“Reported Win Rate” column. This column shows the aggregated numbers reported to us by TeamRankings customer survey respondents. These are real, paying customers who used our Bowl Pick’em Picks product to get picks for specific bowl pools they defined in our system.“Win Rate Multiplier” column. This column shows the Reported Win Rate divided by the Expected Win Rate. If the multiplier is above 1, that implies that our picks increased our customers’ chance to win their pool (or to finish in the money).
Putting Our 2016-17 College Bowl Pick’em Performance In Context
One theme we always stress when it comes to office pool picks is that you need to take a long term view.
When you’re playing against 50 or 100 or 500 people in a pick’em contest, you’re never going to be expected to win, even with the smartest picks on your side.
But winning pools 1.5 or 2 or 3 times as often as expected should bring fantastic returns over the years.
On the surface, it’s reasonable to look at our bowl pick’em results and say, “You guys charge money for bowl pool picks, but in over half of bowl pools last year, your customers didn’t even win anything!”
That’s absolutely correct, but you need to consider that result in context.
Why Context Matters
Our customers performed far better than one would expect, winning prizes in about 40% of bowl pools they entered, compared to an expectation of about 11%.
That edge is what matters, and if it stays at a similar level over time, it should result in quite handsome profits over the long term — as many of our longtime customers have already enjoyed.
It’s also worth noting that our results last college bowl season lined up quite nicely with our general performance expectations for our algorithmic office pool picks.
In internal testing, our office pool simulations typically project that our picks will be 2-10x as likely to win a given pool than the average player, depending on pool size and rules. However, most types of pools fall into the range of a 2-4x Win Rate Multiplier.
Why We Measure Our College Bowl Pick’em Success This Way
Tracking a vanilla metric like “percentage of bowl picks we got right” — a question users ask us fairly frequently — wouldn’t tell us much at all about the level of success our paying customers are actually achieving.
Why? Because it also ignores critical context, such as how many favorites won in a given year, and how many upsets it made sense to pick in different types of pools.
Consider that:
Picking a certain percentage of winners right might be good or it might be bad, depending on how upsets end up occurring in a given bowl season. Some years, picking 67% winners may win you a pool; but in favorite-heavy years it may not even come close. Stats like this may sound good if the number seems high, but still tell a very misleading story about actual customer success winning pools.Optimal pick strategy can vary greatly from pool to pool. The same final score that wins a prize in a 20-person, $5 buy-in corporate office pool may not even come close to finishing in the money in a 1,000-person, $100 buy-in contest run by a Vegas sports book. As a result, a set of picks optimized to win a prize in that first pool will almost certainly be sub-optimal (too conservative) for the second.
We Don’t HAVE One Set Of “Official” Bowl Pick’em Picks
As a result, having the smartest bowl pool picking system also means not recommending that everyone under the sun use the exact same picks.
Because our product optimizes picks for each specific type of bowl pool, we don’t have a universal set of recommended picks to track. We don’t tell customers what picks to make until they first tell us some critical information about their pool(s), plus any additional intelligence they may have about how their opponents are likely to pick certain games.
Then our pick optimization algorithms go to work.
Finally, even discounting all the reasons above, common sense dictates that if you’re telling people your picks can help them win college bowl pick’em pools, there’s really only one ultimate measure of success:
How did people actually do in real bowl pools using your pick recommendations?
How We Measure Customer Performance In Pools
Despite the rise of an increasing number of competitors over the years, as far as we know we are the only site publishing bowl pick’em picks or advice that actually measures customer pool performance at a reasonable scale, and reports that performance publicly.
We use an email survey to ask all of our customers to tell us how they did in their pools. It’s definitely not a perfect method, but we have to rely on it because our users really have no other need to come back to our college Bowl Pick’em Picks product after bowl season is over.
(They got their picks from the site weeks earlier and submitted them to their pool administrator, and typically they don’t need anything else from us after that.)
A downside of this approach is that email surveys generally have fairly low response rates. So to encourage participation, we run a prize raffle that includes anyone who fills out the survey, no matter if they did well or poorly with our picks.
Hopefully this approach also helps us obtain a more representative sampling of results, rather than only having surveys filled out by users who were either extremely happy or extremely unhappy with the product.
Overall, 234 of our college bowl pick’em customers filled out the survey this year. That’s a small fraction of our customer base, but as long as it’s a representative sample, the results should be directionally trustworthy.
College Bowl Pick’em Picks Product Overview
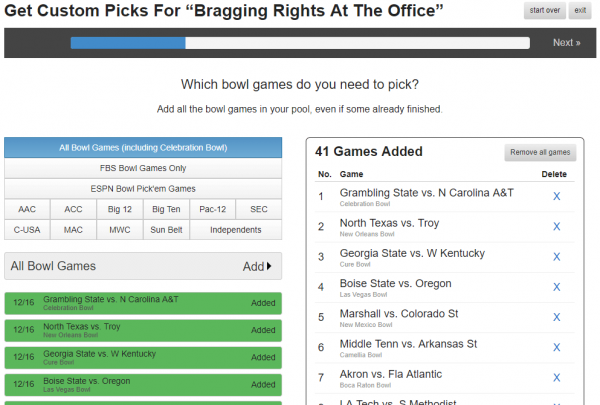
If you’re not familiar with our office pool picks products, here’s a quick summary of our unique approach to helping people win college bowl pools.
The strategy and analysis involved in maximizing your odds to win a specific college football bowl pick’em contest is really just an extremely complex math problem.
With over 40 picks to be made, plus the potential added complexity of confidence points, plus the necessary considerations of pool size and payout structure, optimally solving that problem is far too complicated a job for a human brain.
Up until around 2010, we’d personally been applying the general concepts of value-based picking, game theory, and contrarianism to pool picks for years, with great success.
But a truly precise solution that we could quickly apply across the vast range of pool types and rules and payout structures required the design and implementation of comprehensive, data-driven simulation models. So we built them.
The TeamRankings Process Of Making Bowl Pick’em Picks, In Brief
At a high level:
We used objective computer ratings and Vegas odds to simulate millions of different bowl “seasons” in thousands of pools. All of our bowl game predictions are driven by 100% objective data that’s proven to be the most predictive over time.For each bowl season simulation we ran, we also used national picking trends data to forecast how each simulated bowl pool opponent would pick each bowl game. This gave us a diverse set of fictional opponent entries.By analyzing the results of those simulations, we developed picking algorithms that identify the picks that produced the best chance to win those simulated pools.We apply these picking algorithms to your pool. Combined with win odds predictions from our predictive models, this gives you the best chance to beat your opponents.
Attacking The Source Of Greatest Edge
People often think that getting an edge in bowl pools is all about analyzing one or two matchups better than anyone else. That’s very rarely the case.
Using good data-driven predictive models (like ours) along with Vegas odds, it’s relatively straightforward these days to get unbiased and solidly accurate win odds predictions for individual games.
Unless you’ve got some inside information that no one else has, it’s doubtful you know more than the betting markets and years of historical data do about the prospects for a specific game.
Rather, it’s the extremely complex process of optimizing dozens of independent picks you need to make, in context of how your opponents are expected to pick those same games, that is where the magic happens — where the greatest edge is available for the taking.
We’ve spent years building the most sophisticated solution to solve that big, hairy problem. Real customer results demonstrate its value. Our customers don’t win every year, but they win much more often than expected in the long term. Using data and game theory to exploit an inefficient market is a winning strategy.
If you’d like to learn more and/or get our picks for this bowl season, check out our Bowl Pick’em Picks page.
If you liked this post, please share it. Thank you! Twitter Facebook
NFL Football Pool Picks NFL Survivor Pool Picks NCAA Bracket Picks College Bowl Pool Picks College Football Pool Picks NFL Picks NBA Picks MLB Picks College Football Picks College Basketball Picks NFL Predictions NBA Predictions MLB Predictions College Football Predictions College Basketball Predictions NFL Spread Picks NBA Spread Picks MLB Spread Picks College Football Spread Picks College Basketball Spread Picks NFL Rankings NBA Rankings MLB Rankings College Football Rankings College Basketball Rankings NFL Stats NBA Stats MLB Stats College Football Stats College Basketball Stats NFL Odds NBA Odds MLB Odds College Football Odds College Basketball Odds A product ofTeamRankings BlogAboutTeamJobsContact
© 2005-2024 Team Rankings, LLC. All Rights Reserved. Statistical data provided by Gracenote.
TeamRankings.com is not affiliated with the National Collegiate Athletic Association (NCAA®) or March Madness Athletic Association, neither of which has supplied, reviewed, approved or endorsed the material on this site. TeamRankings.com is solely responsible for this site but makes no guarantee about the accuracy or completeness of the information herein.
Terms of ServicePrivacy Policy


