NFL Week 3 Betting Recap: Point Spread, Over/Under Results & Analysis (2020)
September 29, 2020 – by Jason Lisk
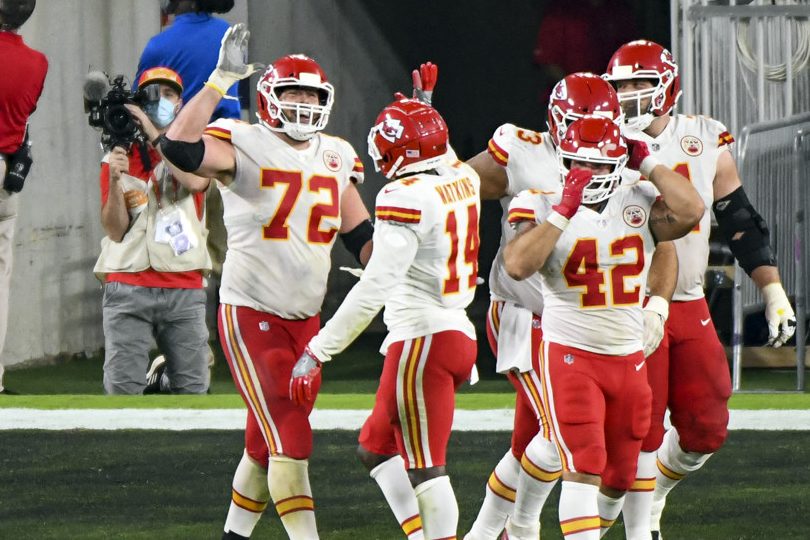
The Chiefs are a high value choice again (Photo by Mark Goldman/Icon Sportswire)
The Kansas City Chiefs closed out Week 3 with a victory over Baltimore in the most anticipated heavyweight showdown. At the other end of the spectrum, after three games, eight different NFL teams are still looking for their first victory.
In this post, we examine not only how teams performed against the point spread and over/under lines in Week 3, but also review some of the fluky, improbable outcomes that can make ATS records misleading.
This level of analysis often provides clues as to which teams may be setting up well to cover the spread in the future.
(To search for your own NFL betting trends, we invite you to use the beta version of our BetIQ Trend Finder Tool.)
NFL Week 1 Picks
Betting – Survivor – Pick’em
Start Free TrialGet The Season
NFL Week 3 By the Betting Numbers
Biggest upset: Carolina over LA Chargers (+6.5, +237 money line)Biggest ATS cover margin: San Francisco over NY Giants (+24, won by 27 points as 3-point favorite)Most points above over/under line: LA Rams-Buffalo (+20.5, 67 total points vs. O/U line of 46.5)Most points below over/under line: Carolina-LA Chargers (-6.5, 37 total points vs. O/U line of 43.5)Most points scored vs. team expectation: Green Bay (37 points vs. 24.25 expected)Fewest points scored vs. team expectation: Jacksonville (13 points vs. 26.0 expected)
Kansas City Chiefs Dominate Ravens
The NFL’s showcase game wasn’t as close as the final 34-20 score indicated. Kansas City did plenty of the little things that normally lose football games (see the Turnovers, Miscues & Failures section below) but still won comfortably.
The Chiefs out-gained the Ravens 517 total yards to 228. Ravens QB Lamar Jackson had only 70 net passing yards, the lowest output in a start in his career.
Baltimore is now 21-1 in the regular season when Lamar Jackson starts against anyone else, and 0-3 against the Kansas City Chiefs.
After a shaky game against the Chargers in Week 2, Kansas City now moves to the No. 1 spot in our NFL predictive power ratings and also becomes the strong favorite to earn the bye as the No. 1 seed in the AFC with the head-to-head tiebreaker over Baltimore.
Comebacks Galore
There was a time when double-digit second-half comebacks were rare events. Now, we seemingly get them every week. Week 3 was no exception, and it makes for some nervy times if you have the team with the lead in a situation where your bet looked safe.
In Week 3, we got the following big comebacks:
The Bills had a 28-3 lead late in the third quarter, before the Rams stormed back with 29 straight points in 15 minutes of game time. Buffalo, though, survived with a late touchdown drive to retake the lead, after a controversial fourth down penalty.The Vikings had a 24-12 lead with 20 minutes remaining, but two touchdown drives and two long field goals by Stephen Gostkowski brought Tennessee all the way back for the 31-30 win.The Falcons once again provided the biggest collapse of the week. Atlanta was up 16 with six minutes left, but surrendered 20 points to the Bears and Nick Foles, who replaced Mitch Trubisky at quarterback.
Are the Bears the Worst 3-0 Team Ever?
With Chicago’s second big comeback of the year (along with Week 1 against the Lions), the Bears have moved to 3-0. Those wins have all come in close fashion, in games against the Lions, Giants, and Falcons, teams with a combined 1-8 record so far.
Perhaps tellingly, Chicago benched Mitch Trubisky mid-game against Chicago, despite his 2-0 start.
So where do the Bears rank compared to 3-0 teams? Here is a list of the 3-0 teams with the lowest point differentials through their first 3 wins:
| Team | Year | Points For | Points Against | Differential | Season Wins |
|---|---|---|---|---|---|
| TEN | 2020 | 80 | 74 | 6 | ? |
| WAS | 2005 | 43 | 37 | 6 | 10 |
| JAC | 2004 | 35 | 28 | 7 | 9 |
| NE | 1999 | 77 | 70 | 7 | 8 |
| CHI | 1991 | 51 | 43 | 8 | 11 |
| CHI | 2020 | 74 | 62 | 12 | ? |
| PHI | 1993 | 77 | 65 | 12 | 8 |
| BAL | 2016 | 57 | 44 | 13 | 8 |
| CHI | 2010 | 66 | 51 | 15 | 11 |
| BUF | 2020 | 93 | 77 | 16 | ? |
| MIN | 1996 | 60 | 44 | 16 | 9 |
| NYG | 1994 | 79 | 63 | 16 | 9 |
| ATL | 2015 | 89 | 72 | 17 | 8 |
| MIN | 2000 | 64 | 47 | 17 | 11 |
| NO | 1998 | 62 | 44 | 18 | 6 |
| NYJ | 2000 | 67 | 49 | 18 | 9 |
| BUF | 2019 | 66 | 47 | 19 | 10 |
| TEN | 1999 | 82 | 63 | 19 | 13 |
| JAC | 1998 | 69 | 49 | 20 | 11 |
| SFO | 1990 | 58 | 38 | 20 | 14 |
Lo and behold, the Bears don’t even have the lowest point differential this year among 3-0 starts. The Tennessee Titans have also started 3-0 against teams that are a combined 1-8, and have won three close games and not covered the spread in any of them yet.
Three of the ten lowest point differentials for a team with a 3-0 start in the last 30 years have occurred this season, with the Bears, Titans, and Bills all winning close games in their perfect starts.
NFL Home Field Advantage in 2020
One of the things we will track this year is how home teams are performing, with many teams playing in front of no fans to start the year.
In Week 3, home teams went 6-9-1 SU and 7-9 ATS. That makes home teams 25-22-1 SU (53.1%) and 24-24 ATS (50.0%).
The home teams have been favored, on average, by 2.1 points through the first three weeks, and the average final score margin so far has been +1.4 points in favor of the home team. Week 3 was the first week where the home teams’ scoring margin was lower than the expected spread on average.
Because the small sample size of 2020 games, we can’t definitively conclude anything yet. So far home field advantage does not appear drastically different than the aggregate of recent seasons, though Week 3 showed road teams performing better than expected, compared to Week 2 when home teams performed well against the spread.
For the 2015 to 2019 NFL seasons, the average point spread in Weeks 1 to 3 was 2.4 points in favor of the home team, and the average result was a home team win by 1.6 points. Home teams won 55.7% of those games straight up and covered the spread 48.5% of the time.
2020 Point Spread Result Splits
Here’s how some of the more standard spilts look after Week 3:
| TYPE | ATS W | ATS L | ATS T | ATS % |
|---|---|---|---|---|
| Favorites | 24 | 24 | 0 | 50.0% |
| Underdogs | 24 | 24 | 0 | 50.0% |
| Home Teams | 24 | 24 | 0 | 50.0% |
| Away Teams | 24 | 24 | 0 | 50.0% |
2020 Scoring vs. Historical Seasons
Scoring continues to rise in 2020, now approaching nearly 51 points scored per game through the first three weeks.
So far this year, overs have hit 60.4% of the time (29-19). In the previous five years, the overs hit 51.5% over the first three weeks.
Here’s a running tally of how overall NFL scoring so far in 2020 compares to the full season averages of recent seasons, based on average total points scored per game:
| 2020 | 2019 | 2018 | 2017 | 2016 |
|---|---|---|---|---|
| 49.4 | 45.6 | 46.7 | 43.4 | 45.6 |
Turnovers, Miscues & Failures: Week 3 Edition
In this section each week, we list a summary of drives that ended with turnovers, but not only official turnovers like interceptions and fumbles.
We also tally up other high-leverage events that likely led to either loss of points or great field position for an opponent. Safeties and blocked punts are included in turnovers, and blocked field goals are included in missed field goal attempts.
Week 3 Turnovers, Missed Field Goals, and Failed Attempts
| Team | Turnovers | FG Miss | Downs | TOTAL | ATS Result |
|---|---|---|---|---|---|
| Jacksonville | 2 | 0 | 3 | 5 | Loss |
| NY Jets | 4 | 0 | 1 | 5 | Loss |
| Washington | 5 | 0 | 0 | 5 | Loss |
| Chicago | 2 | 1 | 1 | 4 | Won |
| Dallas | 4 | 0 | 0 | 4 | Loss |
| Denver | 4 | 0 | 0 | 4 | Loss |
| Kansas City | 1 | 1 | 2 | 4 | Won |
| LA Chargers | 4 | 0 | 0 | 4 | Loss |
| LA Rams | 2 | 1 | 1 | 4 | Loss |
| Las Vegas | 3 | 1 | 0 | 4 | Loss |
| Minnesota | 3 | 1 | 0 | 4 | Won |
| NY Giants | 3 | 0 | 1 | 4 | Loss |
| Arizona | 3 | 0 | 0 | 3 | Loss |
| Atlanta | 1 | 1 | 0 | 2 | Loss |
| Baltimore | 1 | 0 | 1 | 2 | Loss |
| Buffalo | 2 | 0 | 0 | 2 | Won |
| Philadelphia | 2 | 0 | 0 | 2 | Loss |
| Green Bay | 0 | 0 | 1 | 1 | Won |
| Houston | 1 | 0 | 0 | 1 | Loss |
| Indianapolis | 0 | 1 | 0 | 1 | Won |
| New England | 1 | 0 | 0 | 1 | Won |
| New Orleans | 1 | 0 | 0 | 1 | Loss |
| San Francisco | 0 | 1 | 0 | 1 | Won |
| Seattle | 1 | 0 | 0 | 1 | Won |
| Tennessee | 1 | 0 | 0 | 1 | Loss |
| Carolina | 0 | 0 | 0 | 0 | Won |
| Cincinnati | 0 | 0 | 0 | 0 | Won |
| Cleveland | 0 | 0 | 0 | 0 | Won |
| Detroit | 0 | 0 | 0 | 0 | Won |
| Miami | 0 | 0 | 0 | 0 | Won |
| Pittsburgh | 0 | 0 | 0 | 0 | Won |
| Tampa Bay | 0 | 0 | 0 | 0 | Won |
Teams with 3 or more turnovers, missed field goals or failed attempts went 3-10 ATS, while those who had zero drives end in those events went 7-0 ATS.
The three exceptions were the Bears’ big comeback (where Atlanta blew a lead despite having opponents make a ton of mistakes for the second week in a row), the Chiefs’ win at Baltimore, and Minnesota’s cover (but SU loss) to the Titans.
Drive-Ending Miscues By Team: 2020 Season Tally
Here’s a summary of the full season so far showing the net number of drives ending in turnovers or miscues for each team. As you might expect, most of the teams at the top have positive spread records while the teams at the bottom have failed to cover.
The Titans stand out as a team that has benefited from opponent mistakes and turnovers but has still not managed to cover the spread.
2020 Season Summary, Drives Ending in Turnovers or Other Failed Plays
| Team | Mistakes | Opp Mistakes | Differential | ATS Record |
|---|---|---|---|---|
| Baltimore | 3 | 13 | 10 | 2-1 |
| Seattle | 2 | 11 | 9 | 3-0 |
| Green Bay | 2 | 7 | 5 | 3-0 |
| Pittsburgh | 3 | 8 | 5 | 2-1 |
| Tampa Bay | 5 | 10 | 5 | 2-1 |
| San Francisco | 5 | 9 | 4 | 2-1 |
| Tennessee | 4 | 8 | 4 | 0-3 |
| Miami | 4 | 8 | 4 | 2-1 |
| LA Rams | 6 | 9 | 3 | 2-1 |
| Cincinnati | 4 | 7 | 3 | 2-1 |
| New England | 5 | 8 | 3 | 2-1 |
| Kansas City | 4 | 6 | 2 | 2-1 |
| New Orleans | 2 | 4 | 2 | 1-2 |
| Atlanta | 7 | 9 | 2 | 1-2 |
| Buffalo | 7 | 7 | 0 | 2-1 |
| Washington | 8 | 7 | -1 | 1-2 |
| Chicago | 8 | 7 | -1 | 2-1 |
| Jacksonville | 7 | 5 | -2 | 2-1 |
| Las Vegas | 4 | 2 | -2 | 2-1 |
| Indianapolis | 6 | 4 | -2 | 2-1 |
| LA Chargers | 5 | 3 | -2 | 2-1 |
| NY Jets | 9 | 6 | -3 | 0-3 |
| Arizona | 7 | 4 | -3 | 2-1 |
| Carolina | 6 | 2 | -4 | 1-2 |
| Detroit | 5 | 1 | -4 | 1-2 |
| Denver | 11 | 6 | -5 | 2-1 |
| NY Giants | 9 | 4 | -5 | 1-2 |
| Houston | 5 | 0 | -5 | 0-3 |
| Minnesota | 7 | 2 | -5 | 1-2 |
| Cleveland | 8 | 2 | -6 | 1-2 |
| Dallas | 8 | 2 | -6 | 0-3 |
| Philadelphia | 10 | 2 | -8 | 0-3 |
2020 NFL ATS & Over/Under Performance By Team
Finally, here are updated against the point spread and over/under records so far in 2020. You can check out more trends on our BetIQ NFL betting trends page.
2020 NFL ATS and O/U Records
| Team | Wins ATS | Losses ATS | Ties ATS | Streak | Over | Under | Push | O/U Streak |
|---|---|---|---|---|---|---|---|---|
| Arizona | 2 | 1 | 0 | L1 | 0 | 3 | 0 | U3 |
| Atlanta | 1 | 2 | 0 | L1 | 3 | 0 | 0 | O3 |
| Baltimore | 2 | 1 | 0 | L1 | 0 | 3 | 0 | U3 |
| Buffalo | 2 | 1 | 0 | W1 | 3 | 0 | 0 | O3 |
| Carolina | 1 | 2 | 0 | W1 | 2 | 1 | 0 | U1 |
| Chicago | 2 | 1 | 0 | W1 | 2 | 1 | 0 | O1 |
| Cincinnati | 2 | 1 | 0 | W2 | 1 | 2 | 0 | U1 |
| Cleveland | 1 | 2 | 0 | W1 | 2 | 1 | 0 | O2 |
| Dallas | 0 | 3 | 0 | L3 | 2 | 1 | 0 | O2 |
| Denver | 2 | 1 | 0 | L1 | 1 | 2 | 0 | U1 |
| Detroit | 1 | 2 | 0 | W1 | 2 | 1 | 0 | U1 |
| Green Bay | 3 | 0 | 0 | W3 | 3 | 0 | 0 | O3 |
| Houston | 0 | 3 | 0 | L3 | 2 | 1 | 0 | O1 |
| Indianapolis | 2 | 1 | 0 | W2 | 1 | 2 | 0 | U2 |
| Jacksonville | 2 | 1 | 0 | L1 | 2 | 1 | 0 | U1 |
| Kansas City | 2 | 1 | 0 | W1 | 1 | 2 | 0 | U2 |
| LA Chargers | 2 | 1 | 0 | L1 | 0 | 3 | 0 | U3 |
| LA Rams | 2 | 1 | 0 | L1 | 2 | 1 | 0 | O2 |
| Las Vegas | 2 | 1 | 0 | L1 | 3 | 0 | 0 | O3 |
| Miami | 2 | 1 | 0 | W2 | 1 | 2 | 0 | U1 |
| Minnesota | 1 | 2 | 0 | W1 | 2 | 1 | 0 | O1 |
| New England | 2 | 1 | 0 | W1 | 2 | 1 | 0 | O2 |
| New Orleans | 1 | 2 | 0 | L2 | 3 | 0 | 0 | O3 |
| NY Giants | 1 | 2 | 0 | L1 | 1 | 2 | 0 | O1 |
| NY Jets | 0 | 3 | 0 | L3 | 2 | 1 | 0 | U1 |
| Philadelphia | 0 | 3 | 0 | L3 | 2 | 1 | 0 | U1 |
| Pittsburgh | 2 | 1 | 0 | W1 | 2 | 1 | 0 | O2 |
| San Francisco | 2 | 1 | 0 | W2 | 2 | 1 | 0 | O2 |
| Seattle | 3 | 0 | 0 | W3 | 3 | 0 | 0 | O3 |
| Tampa Bay | 2 | 1 | 0 | W2 | 2 | 1 | 0 | U1 |
| Tennessee | 0 | 3 | 0 | L3 | 2 | 1 | 0 | O2 |
| Washington | 1 | 2 | 0 | L2 | 2 | 1 | 0 | O1 |
NFL Week 1 Picks
Betting – Survivor – Pick’em
Start Free TrialGet The Season
If you liked this post, please share it. Thank you! Twitter Facebook
NFL Football Pool Picks NFL Survivor Pool Picks NCAA Bracket Picks College Bowl Pool Picks College Football Pool Picks NFL Picks NBA Picks MLB Picks College Football Picks College Basketball Picks NFL Predictions NBA Predictions MLB Predictions College Football Predictions College Basketball Predictions NFL Spread Picks NBA Spread Picks MLB Spread Picks College Football Spread Picks College Basketball Spread Picks NFL Rankings NBA Rankings MLB Rankings College Football Rankings College Basketball Rankings NFL Stats NBA Stats MLB Stats College Football Stats College Basketball Stats NFL Odds NBA Odds MLB Odds College Football Odds College Basketball Odds A product ofTeamRankings BlogAboutTeamJobsContact
© 2005-2024 Team Rankings, LLC. All Rights Reserved. Statistical data provided by Gracenote.
TeamRankings.com is not affiliated with the National Collegiate Athletic Association (NCAA®) or March Madness Athletic Association, neither of which has supplied, reviewed, approved or endorsed the material on this site. TeamRankings.com is solely responsible for this site but makes no guarantee about the accuracy or completeness of the information herein.
Terms of ServicePrivacy Policy